

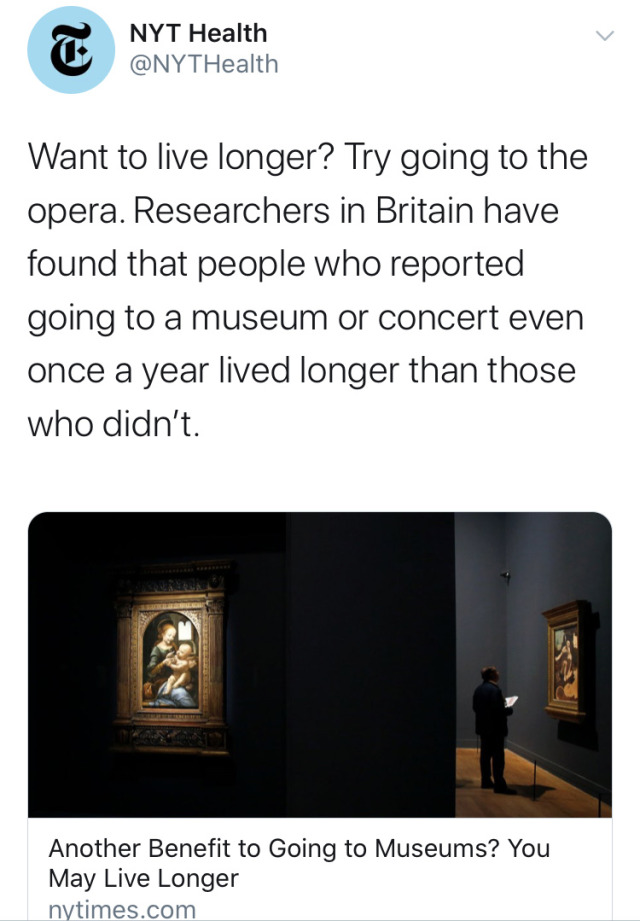
this week in I Am Very Smart: having enough money to go to the opera, museums and concerts correlates with having enough money for food, shelter and basic health needs

They controlled for socioeconomic factors though! The people who conducted this study knew that people with lots of money to attend the opera were also more likely to be able to afford basic necessities, so they controlled for it in their analysis. The fun thing about statistics is that you can control for different confounding factors so you can look at the effects of one independent variable (opera or whatever) on the dependent variable (mortality). Part of being critical of potential biases is actually reading the article and knowing what to look for.

In addition to that very good point about controlling for socioeconomic factors, the article says a single museum or concert per year makes a difference. Most cities have free community concerts (some even have free opera performances!) and museums that are either free, pay-what-you-want, or at least have specific days/times during which they are free or at a significantly reduced cost. Many libraries (which are free) provide free museum passes to card holders. In fact, the article quotes a museum worker who works at a free art museum in Baltimore.
If you actually read the article you would also read that educators are excited about this study because it provides evidence that the arts should be made more accessible financially - by restoring arts programs in the public schools, for example.

So basically what they’re saying is that enriching your life and discovering new things is good for your physical health. That’s actually cool as hell.

so i’m confused. can someone explain how you can “control for socioeconomic factors”?
poverty affects every single part of your life.
it is why we eat the foods we eat (cheap and less nutritious), where we live (poorer neighborhoods have poorer air and water quality), which doctors you see (only certain doctors take certain insurances and the ones who take low-income insurance like medicaid are always overworked, overbooked, and burning out), it affects how much time you have to devote to things like exercise and recreation.
how do you erase how it touches you when it touches everything?
It’s “controlled for” statistically. I haven’t actually read this properly, but in remotely decent research they take data about all factors and use tests designed to prevent making dubious correlations.
So rather than just comparing all people on just opera Y/N vs lifepan/health outcomes, it’s grouping people based on multiple factors at once. It’s not perfect, but it can tease out whether the only people experiencing the benefit also have higher income and your relationship will become weak.
My statistics game is weak, but basically you need to use multivariate analysis, and this requires specialised software.
From a website explaining multivariate analysis:
Multiple regression analysis, often referred to simply as regression analysis, examines the effects of multiple independent variables (predictors) on the value of a dependent variable, or outcome. Regression calculates a coefficient for each independent variable, as well as its statistical significance, to estimate the effect of each predictor on the dependent variable, with other predictors held constant. Researchers in economics and other social sciences often use regression analysis to study social and economic phenomena. An example of a regression study is to examine the effect of education, experience, gender, and ethnicity on income.
Ie: you are using statistical tests to look at the relationship between all your different variables at once, so if the relationship is actually between factors that are not what you’re interested in, that will show up.
@kawuli Does that explanation make sense? I hope this is actually something you were interested in hearing, @lanibgoode, my apologies if not!

It depends on the methods used but basically, they collect a bunch of socioeconomic data like income, where you live, education, etc.
Then they predict your lifespan based on those data. A good way to simplify is to think of an x - y plot with income on the x axis and years lived on the y axis. There’s going to be some line sloping up from left to right.
Then they separate people into two groups based on whether they went to the opera (or whatever) and they get two lines, where the one for opera goers is shifted up a little bit on the y axis.
Say for the no opera people life expectancy is 65 at $10k/year and 80 at $500k/year (these are completely made up numbers). Maybe for the with opera group it’s 68 at $10k/year and 80.5 at $500k/year.
The difference between those lines is the impact that opera going makes, controlled for income.
In reality this is a confusing Thing constructed in like 8-dimensional space (1 dimension per variable you want to control for) instead of a line, but the principle holds.
(disclaimer: you can do this badly and get nonsense, I have not evaluated the statistical methods used in this paper or making any judgment on the validity of the results)

Given it is quite literally a Holiday Joke about How You Can Use Statistics Weirdly by the BMJ which the NYT reported VERY BADLY ON … .
(Very seriously: THE BMJ WAS JOKING. THIS WAS A JOKE PAPER.)

I don’t see anything on the paper page that would let me detect it was a joke.
After googling a bit I don’t think this is a joke?
It’s from the BMJ Christmas issue.
According to the website, “While we welcome light-hearted fare and satire, we do not publish spoofs, hoaxes, or fabricated studies.”
And the Times interviewed one of the coauthors for their article and he seemed perfectly serious.
So basically I feel like everyone involved in this looks pretty bad:
The BMJ, for being very unclear about the epistemic status of their Christmas articles, which seems irresponsible for a medical journal.
The New York Times, for just generally sucking.
And the authors, for publishing a bad study. In fairness, they say “This study was observational and so causality cannot be assumed,” which is true. But in that case, why is there any value in the study?
It’s true that you can use statistics to control for things: in this case, it looks like they tried to control for socioeconomic status, health, etc. But once you’ve controlled for all the stuff you can think of, you’re still left with two hypotheses: that going to museums increases your lifespan, or that some unobserved variable Z causes both going to museums and increased lifespan. Z could be something else you haven’t thought of, or it could be something you tried to measure but did so imperfectly. Eg, you try to measure health by taking a bunch of vital statistics, but there’s some measurement error, and some natural variation in people’s blood pressure from day to day. So you end up with an imperfect measure of health, and it turns out that going to museums is somewhat correlated with people’s true level of health that you’ve failed to perfectly measure.
In this case, the latter hypothesis sounds more likely to me. It could be the former, it’s not crazy. But the study hasn’t really done much to distinguish between the two. This is why we have experiments, and instrumental variables, and other stuff that social scientists have come up with to actually measure causality.